The box is an AOOSTAR mini PC (Intel i5-1235U, 32 GB RAM) running Proxmox with two LXC containers: a NAS with ZFS (a 4-drive RAIDZ1 pool for bulk storage and a mirrored NVMe pool for fast data) and a Frigate NVR watching four security cameras with a Google Coral TPU. Once it was all running I wanted one page that answered the question "is everything fine?" without logging into four different admin panels. So I built one.
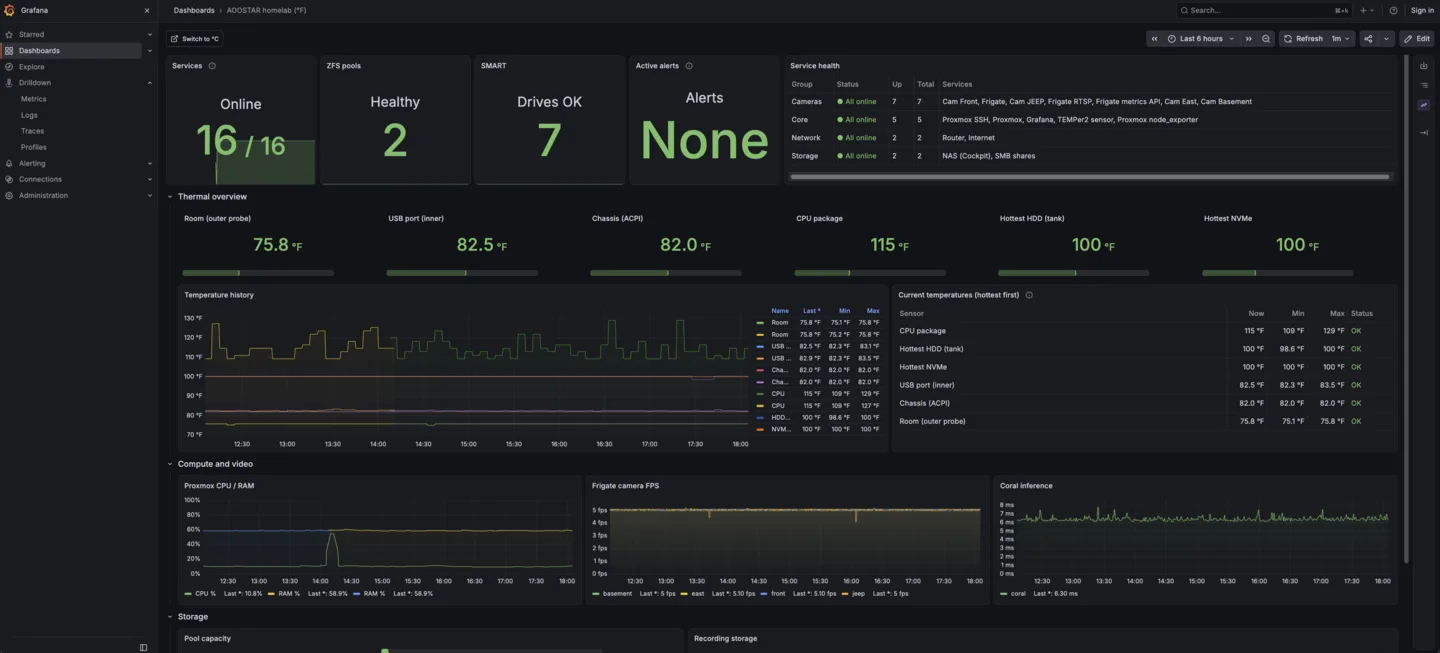
The top row is the status board: services online (16 of 16), ZFS pool health, SMART drive status, active alerts, and a grouped health table for cameras, core services, network and storage. Below that is a thermal section with the room temperature from a TEMPer2 USB probe plugged into the host, chassis and CPU package temperatures from ACPI, and the hottest hard drive and NVMe from SMART. A history graph keeps 30 days of readings. Further down: Proxmox CPU and RAM, per-camera FPS from Frigate, Coral inference time in milliseconds, pool capacity and recording storage.
Under the hood a third container runs Prometheus, blackbox_exporter and Grafana. The Proxmox host runs node_exporter with textfile collectors for SMART temperatures and the USB thermometer, and a small Python script that speaks raw HID to the TEMPer2 so no extra packages are needed. Blackbox probes cover HTTPS, TCP and ICMP targets, and a recording rule folds every probe into a single service_up metric with service and group labels, which is what the counts and the health table read. Frigate's internal metrics API is forwarded with socat and locked to the monitor container's address.
The dashboard itself is not built in the Grafana UI. A Python generator writes two JSON dashboards, one in Fahrenheit and one in Celsius with converted queries and thresholds, and Grafana file-provisions them. A "Switch to °C" link in the header flips between the two. Panels refresh in place every minute. Grafana runs with anonymous admin access on the LAN, so it loads instantly on a wall-mounted tablet with no login.